OI CEO in USA Today on the future of polling — learn more!

AI + human expertise for
cleaner, faster, more reliable
quantitative research.
cleaner, faster, more reliable
quantitative research.
From brand to ads, reputation to trends — custom surveys and real-time insights give you the flexibility to track what matters most, when it matters most.


Our AI-powered platform keeps your data stable, your insights fast, and your analysis deeper than a topline.
Our team partners with you to design smarter surveys, interpret the signals, and deliver insights that drive action.
Request demoCustom surveys, flexible cadence, and instant updates – all built on AI and expert oversight you can trust
Request a demo
Access 800M+ professionals via LinkedIn-authenticated identities and domain validation. Target by role, seniority, function, and company size for precise, repeatable insights.

From setup to storytelling, we make custom research seamless.
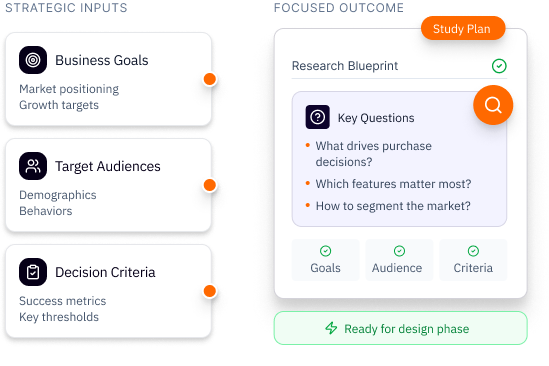
We collaborate to set the right goals, audience targets, and cadence. Tracking surveys are tailored to your brand, campaigns, or reputation needs – with flexibility to add custom ad hoc modules at no extra cost
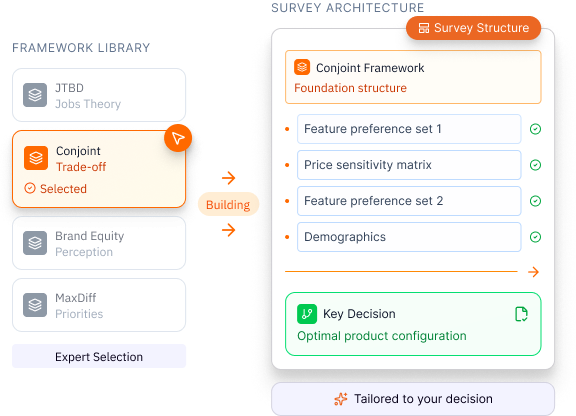
Our researchers handle survey design, programming, and QA. With our AI-powered backend, changes can go live in under 24 hours, and fielding can run at any cadence – always-on, weekly, monthly, or quarterly.
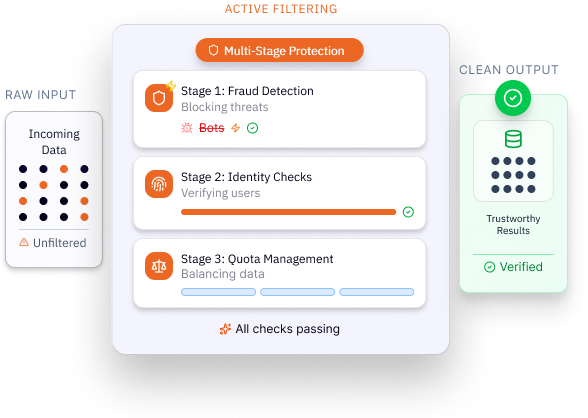
Our AI manages quotas, detects fraud, and ensures longitudinal stability so shifts reflect real consumer movement – not sample noise
Data flows instantly into our tracking dashboard, where built-in analytics (drivers, SWOT, perceptual maps, pricing, concept testing, etc.) make insights actionable on day one
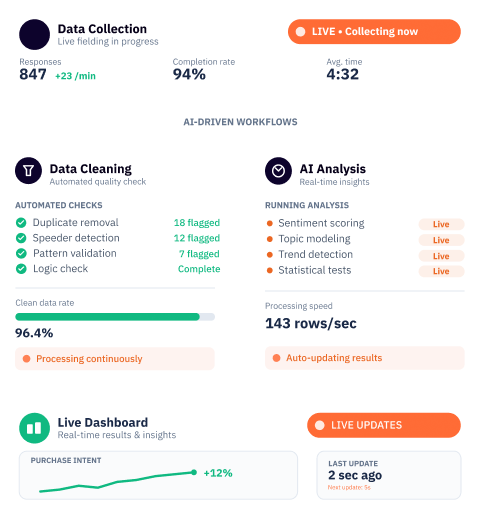
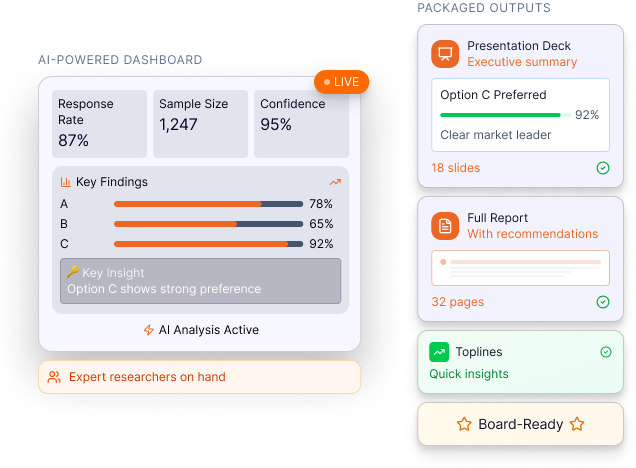
Use AI workflows to surface trends, uncover “why” drivers, and generate toplines, slides, and visualizations on demand. Our consultants are always available for training, interpretation, and storytelling
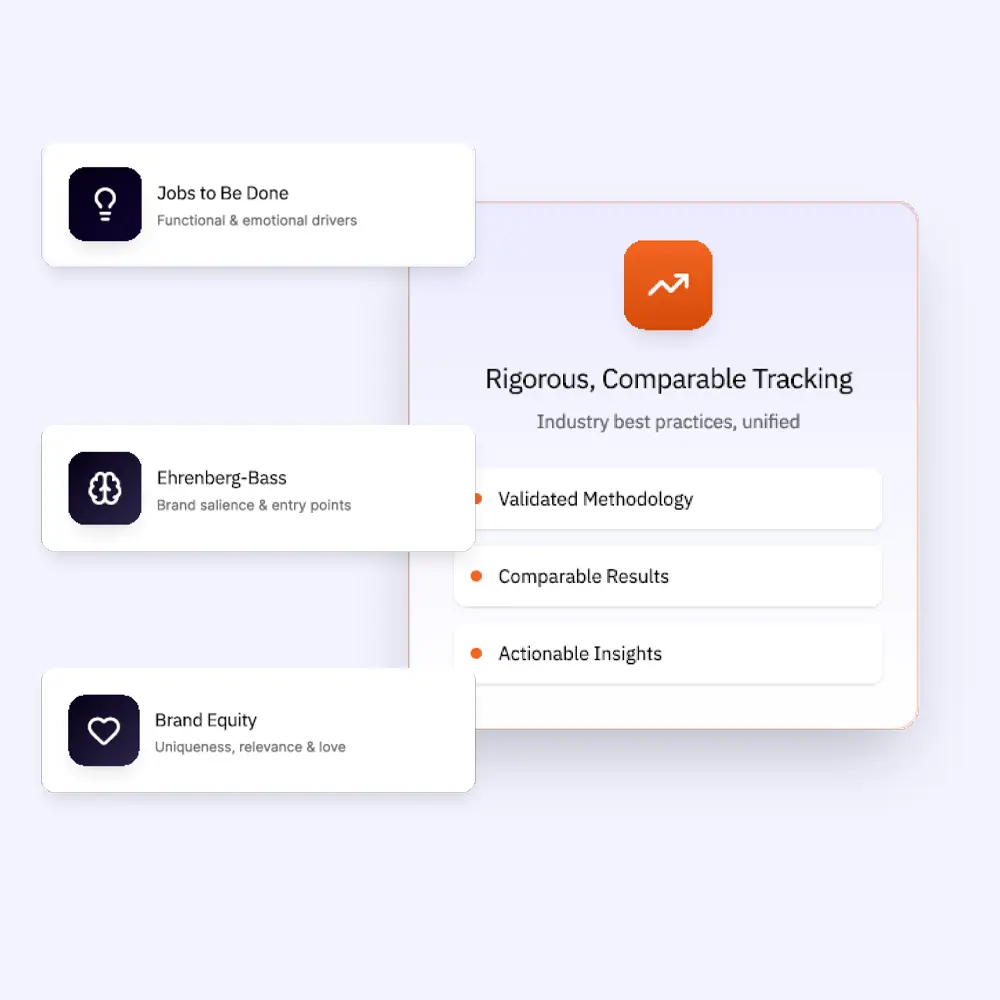
We integrate the models you already rely on – Jobs to Be Done, Ehrenberg-Bass, and brand equity frameworks – so your tracking is rigorous, comparable, and aligned to industry best practices.
From brand to CX to comms, OI makes longitudinal tracking flexible, stable, and fast.


.avif)